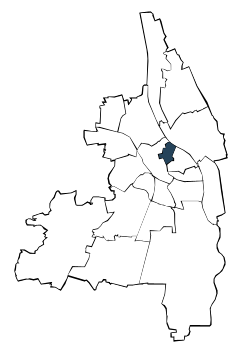
| Jahr | die 5 durchschnittlich häufigsten Bezugsländer | |||||||||||||
| Türkei | Rumänien | Italien | Polen | Kroatien | Sonstige Länder | Deutsche mit Migrationshintergrund und Ausländer | ||||||||
| Anzahl | % | Anzahl | % | Anzahl | % | Anzahl | % | Anzahl | % | Anzahl | % | Anzahl | % | |
| 2006 | 649 | 6,6 | 266 | 2,7 | 246 | 2,5 | 203 | 2,1 | 98 | 1,0 | 1.877 | 19,1 | 3.339 | 34,0 |
| 2007 | 649 | 6,7 | 267 | 2,7 | 247 | 2,5 | 192 | 2,0 | 85 | 0,9 | 1.865 | 19,2 | 3.305 | 34,0 |
| 2008 | 601 | 6,2 | 267 | 2,8 | 243 | 2,5 | 181 | 1,9 | 90 | 0,9 | 1.853 | 19,2 | 3.235 | 33,6 |
| 2009 | 584 | 6,1 | 256 | 2,7 | 230 | 2,4 | 200 | 2,1 | 100 | 1,0 | 1.882 | 19,6 | 3.252 | 33,8 |
| 2010 | 562 | 5,8 | 274 | 2,8 | 215 | 2,2 | 179 | 1,8 | 98 | 1,0 | 1.941 | 20,0 | 3.269 | 33,7 |
| 2011 | 558 | 5,6 | 283 | 2,8 | 246 | 2,5 | 189 | 1,9 | 94 | 0,9 | 2.075 | 20,8 | 3.445 | 34,5 |
| 2012 | 557 | 5,5 | 314 | 3,1 | 278 | 2,7 | 216 | 2,1 | 92 | 0,9 | 2.121 | 21,0 | 3.578 | 35,4 |
| 2013 | 540 | 5,3 | 333 | 3,3 | 304 | 3,0 | 235 | 2,3 | 105 | 1,0 | 2.211 | 21,6 | 3.728 | 36,4 |
| 2014 | 534 | 5,2 | 357 | 3,5 | 319 | 3,1 | 248 | 2,4 | 127 | 1,2 | 2.339 | 22,6 | 3.924 | 37,9 |
| 2015 | 518 | 4,9 | 414 | 3,9 | 329 | 3,1 | 250 | 2,4 | 158 | 1,5 | 2.491 | 23,5 | 4.160 | 39,3 |
| 2016 | 505 | 4,7 | 454 | 4,2 | 344 | 3,2 | 222 | 2,1 | 183 | 1,7 | 2.623 | 24,4 | 4.331 | 40,3 |
| 2017 | 505 | 4,6 | 448 | 4,1 | 362 | 3,3 | 213 | 2,0 | 218 | 2,0 | 2.789 | 25,7 | 4.535 | 41,7 |
| 2018 | 488 | 4,5 | 472 | 4,3 | 336 | 3,1 | 220 | 2,0 | 289 | 2,6 | 2.852 | 26,1 | 4.657 | 42,5 |
| 2019 | 508 | 4,6 | 474 | 4,3 | 355 | 3,2 | 212 | 1,9 | 330 | 3,0 | 2.939 | 26,6 | 4.818 | 43,6 |
| 2020 | 522 | 4,8 | 477 | 4,3 | 378 | 3,4 | 214 | 2,0 | 333 | 3,0 | 2.954 | 26,9 | 4.878 | 44,5 |
| 2021 | 503 | 4,5 | 481 | 4,3 | 373 | 3,4 | 210 | 1,9 | 317 | 2,9 | 3.103 | 28,0 | 4.987 | 45,1 |
| 2022 | 482 | 4,3 | 473 | 4,2 | 377 | 3,4 | 210 | 1,9 | 328 | 2,9 | 3.284 | 29,5 | 5.154 | 46,2 |
| 2023 | . | . | . | . | 360 | 3,3 | 205 | 1,9 | 325 | 3,0 | 4.202 | 38,3 | 5.092 | 46,4 |
| Türkei | Rumänien | Italien | |||
| Polen | Kroatien |

Adresssuche
