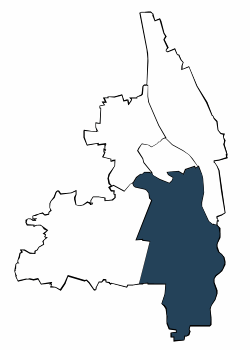
| Jahr | die 5 durchschnittlich häufigsten Bezugsländer | |||||||||||||
| Türkei | Russische Föderation | Kasachstan | Rumänien | Polen | Sonstige Länder | Deutsche mit Migrationshintergrund und Ausländer | ||||||||
| Anzahl | % | Anzahl | % | Anzahl | % | Anzahl | % | Anzahl | % | Anzahl | % | Anzahl | % | |
| 2006 | 4.881 | 7,5 | 3.034 | 4,6 | 2.885 | 4,4 | 2.708 | 4,1 | 2.422 | 3,7 | 10.546 | 16,1 | 26.476 | 40,4 |
| 2007 | 4.860 | 7,4 | 3.055 | 4,7 | 2.947 | 4,5 | 2.702 | 4,1 | 2.368 | 3,6 | 10.667 | 16,3 | 26.599 | 40,7 |
| 2008 | 4.883 | 7,5 | 3.099 | 4,8 | 2.956 | 4,6 | 2.692 | 4,1 | 2.260 | 3,5 | 10.769 | 16,6 | 26.659 | 41,1 |
| 2009 | 4.893 | 7,6 | 3.193 | 4,9 | 3.078 | 4,8 | 2.685 | 4,1 | 2.203 | 3,4 | 10.559 | 16,3 | 26.611 | 41,1 |
| 2010 | 4.803 | 7,4 | 3.279 | 5,1 | 3.123 | 4,8 | 2.646 | 4,1 | 2.153 | 3,3 | 10.846 | 16,7 | 26.850 | 41,4 |
| 2011 | 4.794 | 7,4 | 3.317 | 5,1 | 3.197 | 4,9 | 2.688 | 4,1 | 2.103 | 3,2 | 11.113 | 17,1 | 27.212 | 41,8 |
| 2012 | 4.776 | 7,3 | 3.367 | 5,1 | 3.256 | 5,0 | 2.690 | 4,1 | 2.072 | 3,2 | 11.438 | 17,5 | 27.599 | 42,1 |
| 2013 | 4.732 | 7,2 | 3.418 | 5,2 | 3.281 | 5,0 | 2.740 | 4,2 | 2.139 | 3,2 | 11.942 | 18,1 | 28.252 | 42,9 |
| 2014 | 4.729 | 7,1 | 3.435 | 5,2 | 3.288 | 4,9 | 2.927 | 4,4 | 2.168 | 3,3 | 12.448 | 18,7 | 28.995 | 43,5 |
| 2015 | 4.692 | 7,0 | 3.427 | 5,1 | 3.218 | 4,8 | 3.070 | 4,6 | 2.190 | 3,3 | 12.967 | 19,3 | 29.564 | 43,9 |
| 2016 | 4.660 | 6,8 | 3.464 | 5,1 | 3.221 | 4,7 | 3.179 | 4,7 | 2.174 | 3,2 | 13.799 | 20,3 | 30.497 | 44,8 |
| 2017 | 4.612 | 6,8 | 3.465 | 5,1 | 3.190 | 4,7 | 3.259 | 4,8 | 2.166 | 3,2 | 14.196 | 20,8 | 30.888 | 45,3 |
| 2018 | 4.651 | 6,8 | 3.463 | 5,1 | 3.164 | 4,6 | 3.334 | 4,9 | 2.118 | 3,1 | 14.591 | 21,3 | 31.321 | 45,7 |
| 2019 | 4.685 | 6,8 | 3.478 | 5,1 | 3.129 | 4,5 | 3.379 | 4,9 | 2.055 | 3,0 | 15.190 | 22,1 | 31.916 | 46,3 |
| 2020 | 4.751 | 6,9 | 3.458 | 5,0 | 3.068 | 4,5 | 3.397 | 5,0 | 1.978 | 2,9 | 15.468 | 22,5 | 32.120 | 46,8 |
| 2021 | 4.753 | 6,9 | 3.427 | 5,0 | 2.987 | 4,4 | 3.440 | 5,0 | 1.939 | 2,8 | 15.941 | 23,3 | 32.487 | 47,4 |
| 2022 | 4.806 | 6,9 | 3.392 | 4,9 | 2.942 | 4,2 | 3.481 | 5,0 | 1.913 | 2,7 | 17.454 | 25,0 | 33.988 | 48,8 |
| 2023 | . | . | . | . | 2.920 | 4,2 | . | . | 1.873 | 2,7 | 30.035 | 42,8 | 34.828 | 49,6 |
| Türkei | Russische Föderation | Kasachstan | |||
| Rumänien | Polen |

Adresssuche
