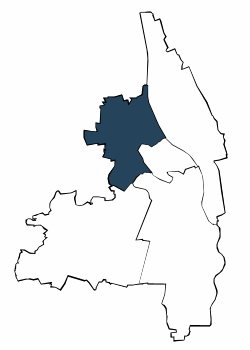
| Jahr | die 5 durchschnittlich häufigsten Bezugsländer | |||||||||||||
| Türkei | Rumänien | Russische Föderation | Kasachstan | Polen | Sonstige Länder | Deutsche mit Migrationshintergrund und Ausländer | ||||||||
| Anzahl | % | Anzahl | % | Anzahl | % | Anzahl | % | Anzahl | % | Anzahl | % | Anzahl | % | |
| 2006 | 7.191 | 10,2 | 3.358 | 4,7 | 2.181 | 3,1 | 1.813 | 2,6 | 1.970 | 2,8 | 14.140 | 20,0 | 30.653 | 43,4 |
| 2007 | 7.228 | 10,2 | 3.368 | 4,7 | 2.302 | 3,2 | 1.908 | 2,7 | 1.930 | 2,7 | 14.192 | 20,0 | 30.928 | 43,5 |
| 2008 | 7.233 | 10,2 | 3.391 | 4,8 | 2.348 | 3,3 | 1.980 | 2,8 | 1.899 | 2,7 | 14.347 | 20,2 | 31.198 | 43,9 |
| 2009 | 7.337 | 10,3 | 3.405 | 4,8 | 2.325 | 3,3 | 2.017 | 2,8 | 1.814 | 2,6 | 14.283 | 20,1 | 31.181 | 43,9 |
| 2010 | 7.211 | 10,1 | 3.481 | 4,9 | 2.323 | 3,2 | 2.054 | 2,9 | 1.775 | 2,5 | 14.733 | 20,6 | 31.577 | 44,2 |
| 2011 | 7.246 | 10,1 | 3.559 | 4,9 | 2.337 | 3,2 | 2.076 | 2,9 | 1.818 | 2,5 | 15.180 | 21,1 | 32.216 | 44,7 |
| 2012 | 7.143 | 9,7 | 3.810 | 5,2 | 2.370 | 3,2 | 2.108 | 2,9 | 1.933 | 2,6 | 16.174 | 21,9 | 33.538 | 45,5 |
| 2013 | 7.133 | 9,4 | 4.209 | 5,6 | 2.372 | 3,1 | 2.152 | 2,9 | 2.048 | 2,7 | 17.469 | 23,1 | 35.383 | 46,9 |
| 2014 | 7.190 | 9,3 | 4.639 | 6,0 | 2.402 | 3,1 | 2.154 | 2,8 | 2.162 | 2,8 | 18.619 | 24,0 | 37.166 | 47,9 |
| 2015 | 7.145 | 9,0 | 5.089 | 6,4 | 2.466 | 3,1 | 2.166 | 2,7 | 2.250 | 2,8 | 20.148 | 25,3 | 39.264 | 49,3 |
| 2016 | 7.067 | 8,7 | 5.452 | 6,7 | 2.428 | 3,0 | 2.141 | 2,6 | 2.204 | 2,7 | 21.808 | 26,9 | 41.100 | 50,7 |
| 2017 | 7.044 | 8,6 | 5.777 | 7,0 | 2.470 | 3,0 | 2.129 | 2,6 | 2.215 | 2,7 | 22.746 | 27,7 | 42.381 | 51,7 |
| 2018 | 7.017 | 8,5 | 5.997 | 7,2 | 2.491 | 3,0 | 2.124 | 2,6 | 2.170 | 2,6 | 23.781 | 28,7 | 43.580 | 52,6 |
| 2019 | 6.998 | 8,4 | 6.059 | 7,3 | 2.455 | 3,0 | 2.109 | 2,5 | 2.212 | 2,7 | 24.633 | 29,6 | 44.466 | 53,5 |
| 2020 | 6.947 | 8,4 | 6.216 | 7,5 | 2.411 | 2,9 | 2.085 | 2,5 | 2.147 | 2,6 | 24.872 | 30,0 | 44.678 | 53,9 |
| 2021 | 6.887 | 8,3 | 6.193 | 7,5 | 2.312 | 2,8 | 2.064 | 2,5 | 2.080 | 2,5 | 25.498 | 30,8 | 45.034 | 54,5 |
| 2022 | 6.930 | 8,2 | 6.251 | 7,4 | 2.339 | 2,8 | 2.028 | 2,4 | 2.030 | 2,4 | 27.448 | 32,6 | 47.026 | 55,9 |
| 2023 | 7.001 | 8,2 | 6.147 | 7,2 | 2.368 | 2,8 | 1.992 | 2,3 | 2.022 | 2,4 | 28.879 | 33,8 | 48.409 | 56,7 |
| 2024 | 7.063 | 8,2 | 6.063 | 7,0 | 2.366 | 2,7 | 1.959 | 2,3 | 1.961 | 2,3 | 30.393 | 35,1 | 49.805 | 57,6 |
| Türkei | Rumänien | Russische Föderation | |||
| Kasachstan | Polen |

Adresssuche
