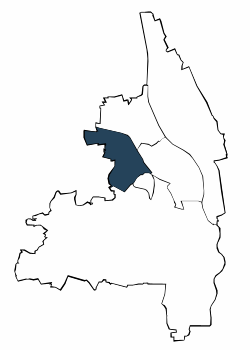
| Jahr | die 5 durchschnittlich häufigsten Bezugsländer | |||||||||||||
| Türkei | Rumänien | Kasachstan | Russische Föderation | Polen | Sonstige Länder | Deutsche mit Migrationshintergrund und Ausländer | ||||||||
| Anzahl | % | Anzahl | % | Anzahl | % | Anzahl | % | Anzahl | % | Anzahl | % | Anzahl | % | |
| 2006 | 3.333 | 8,4 | 1.690 | 4,3 | 1.131 | 2,9 | 1.143 | 2,9 | 1.103 | 2,8 | 7.747 | 19,5 | 16.147 | 40,7 |
| 2007 | 3.404 | 8,5 | 1.696 | 4,2 | 1.145 | 2,9 | 1.202 | 3,0 | 1.046 | 2,6 | 7.806 | 19,6 | 16.299 | 40,8 |
| 2008 | 3.448 | 8,6 | 1.676 | 4,2 | 1.157 | 2,9 | 1.224 | 3,1 | 1.028 | 2,6 | 7.843 | 19,6 | 16.376 | 41,0 |
| 2009 | 3.517 | 8,8 | 1.703 | 4,3 | 1.172 | 2,9 | 1.210 | 3,0 | 1.004 | 2,5 | 7.764 | 19,4 | 16.370 | 40,9 |
| 2010 | 3.471 | 8,6 | 1.731 | 4,3 | 1.188 | 2,9 | 1.224 | 3,0 | 983 | 2,4 | 8.055 | 19,9 | 16.652 | 41,1 |
| 2011 | 3.547 | 8,7 | 1.787 | 4,4 | 1.219 | 3,0 | 1.231 | 3,0 | 1.008 | 2,5 | 8.082 | 19,8 | 16.874 | 41,3 |
| 2012 | 3.546 | 8,5 | 1.836 | 4,4 | 1.236 | 3,0 | 1.245 | 3,0 | 1.031 | 2,5 | 8.522 | 20,4 | 17.416 | 41,6 |
| 2013 | 3.561 | 8,3 | 1.935 | 4,5 | 1.265 | 3,0 | 1.260 | 2,9 | 1.068 | 2,5 | 8.950 | 20,9 | 18.039 | 42,2 |
| 2014 | 3.620 | 8,3 | 1.999 | 4,6 | 1.257 | 2,9 | 1.258 | 2,9 | 1.116 | 2,6 | 9.411 | 21,5 | 18.661 | 42,6 |
| 2015 | 3.619 | 8,0 | 2.163 | 4,8 | 1.276 | 2,8 | 1.321 | 2,9 | 1.164 | 2,6 | 10.171 | 22,6 | 19.714 | 43,7 |
| 2016 | 3.618 | 7,9 | 2.322 | 5,1 | 1.241 | 2,7 | 1.321 | 2,9 | 1.174 | 2,6 | 10.889 | 23,7 | 20.565 | 44,8 |
| 2017 | 3.602 | 7,8 | 2.417 | 5,2 | 1.227 | 2,7 | 1.351 | 2,9 | 1.181 | 2,6 | 11.321 | 24,5 | 21.099 | 45,6 |
| 2018 | 3.596 | 7,7 | 2.393 | 5,1 | 1.230 | 2,6 | 1.372 | 2,9 | 1.175 | 2,5 | 11.773 | 25,3 | 21.539 | 46,2 |
| 2019 | 3.629 | 7,8 | 2.373 | 5,1 | 1.233 | 2,6 | 1.353 | 2,9 | 1.158 | 2,5 | 12.305 | 26,3 | 22.051 | 47,1 |
| 2020 | 3.595 | 7,7 | 2.390 | 5,1 | 1.201 | 2,6 | 1.283 | 2,8 | 1.152 | 2,5 | 12.439 | 26,7 | 22.060 | 47,4 |
| 2021 | 3.639 | 7,8 | 2.350 | 5,1 | 1.197 | 2,6 | 1.242 | 2,7 | 1.120 | 2,4 | 12.760 | 27,4 | 22.308 | 47,9 |
| 2022 | 3.659 | 7,7 | 2.428 | 5,1 | 1.179 | 2,5 | 1.268 | 2,7 | 1.106 | 2,3 | 13.630 | 28,9 | 23.270 | 49,3 |
| 2023 | . | . | . | . | 1.168 | 2,4 | . | . | 1.115 | 2,3 | 22.163 | 45,7 | 24.446 | 50,4 |
| Türkei | Rumänien | Kasachstan | |||
| Russische Föderation | Polen |

Adresssuche
