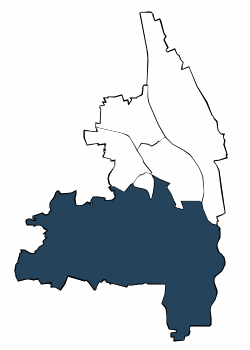
| Jahr | die 5 durchschnittlich häufigsten Bezugsländer | |||||||||||||
| Türkei | Rumänien | Kasachstan | Russische Föderation | Polen | Sonstige Länder | Deutsche mit Migrationshintergrund und Ausländer | ||||||||
| Anzahl | % | Anzahl | % | Anzahl | % | Anzahl | % | Anzahl | % | Anzahl | % | Anzahl | % | |
| 2006 | 4.357 | 6,1 | 2.806 | 3,9 | 2.563 | 3,6 | 2.582 | 3,6 | 2.563 | 3,6 | 10.488 | 14,7 | 25.359 | 35,5 |
| 2007 | 4.382 | 6,1 | 2.833 | 4,0 | 2.688 | 3,8 | 2.639 | 3,7 | 2.511 | 3,5 | 10.567 | 14,8 | 25.620 | 35,8 |
| 2008 | 4.415 | 6,2 | 2.849 | 4,0 | 2.739 | 3,8 | 2.700 | 3,8 | 2.404 | 3,4 | 10.622 | 14,9 | 25.729 | 36,1 |
| 2009 | 4.432 | 6,2 | 2.859 | 4,0 | 2.843 | 4,0 | 2.787 | 3,9 | 2.361 | 3,3 | 10.526 | 14,7 | 25.808 | 36,1 |
| 2010 | 4.398 | 6,1 | 2.849 | 4,0 | 2.891 | 4,0 | 2.931 | 4,1 | 2.301 | 3,2 | 10.640 | 14,8 | 26.010 | 36,3 |
| 2011 | 4.419 | 6,1 | 2.931 | 4,0 | 2.981 | 4,1 | 3.017 | 4,2 | 2.259 | 3,1 | 10.900 | 15,1 | 26.507 | 36,6 |
| 2012 | 4.475 | 6,1 | 2.939 | 4,0 | 3.067 | 4,2 | 3.118 | 4,3 | 2.251 | 3,1 | 11.255 | 15,4 | 27.105 | 37,1 |
| 2013 | 4.518 | 6,1 | 3.038 | 4,1 | 3.108 | 4,2 | 3.189 | 4,3 | 2.301 | 3,1 | 11.794 | 16,0 | 27.948 | 37,9 |
| 2014 | 4.551 | 6,1 | 3.153 | 4,2 | 3.143 | 4,2 | 3.222 | 4,3 | 2.351 | 3,1 | 12.286 | 16,5 | 28.706 | 38,5 |
| 2015 | 4.534 | 6,0 | 3.304 | 4,4 | 3.149 | 4,2 | 3.306 | 4,4 | 2.385 | 3,2 | 12.879 | 17,0 | 29.557 | 39,1 |
| 2016 | 4.554 | 5,9 | 3.372 | 4,4 | 3.187 | 4,1 | 3.371 | 4,4 | 2.380 | 3,1 | 13.779 | 17,9 | 30.643 | 39,9 |
| 2017 | 4.542 | 5,9 | 3.425 | 4,4 | 3.169 | 4,1 | 3.365 | 4,4 | 2.365 | 3,1 | 14.358 | 18,6 | 31.224 | 40,4 |
| 2018 | 4.589 | 5,9 | 3.472 | 4,5 | 3.174 | 4,1 | 3.372 | 4,3 | 2.327 | 3,0 | 14.803 | 19,0 | 31.737 | 40,8 |
| 2019 | 4.649 | 5,9 | 3.471 | 4,4 | 3.129 | 4,0 | 3.411 | 4,4 | 2.289 | 2,9 | 15.532 | 19,9 | 32.481 | 41,5 |
| 2020 | 4.697 | 6,0 | 3.489 | 4,5 | 3.061 | 3,9 | 3.407 | 4,4 | 2.198 | 2,8 | 15.691 | 20,2 | 32.543 | 41,8 |
| 2021 | 4.724 | 6,0 | 3.550 | 4,5 | 3.029 | 3,9 | 3.395 | 4,3 | 2.118 | 2,7 | 16.303 | 20,9 | 33.119 | 42,4 |
| 2022 | 4.783 | 6,1 | 3.624 | 4,6 | 2.993 | 3,8 | 3.382 | 4,3 | 2.107 | 2,7 | 17.647 | 22,3 | 34.536 | 43,7 |
| 2023 | . | . | . | . | 2.960 | 3,7 | . | . | 2.087 | 2,6 | 30.183 | 38,1 | 35.230 | 44,5 |
| Türkei | Rumänien | Kasachstan | |||
| Russische Föderation | Polen |

Adresssuche
