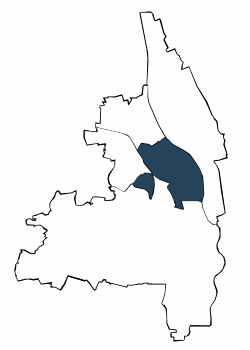
| Jahr | die 5 durchschnittlich häufigsten Bezugsländer | |||||||||||||
| Türkei | Rumänien | Italien | Russische Föderation | Polen | Sonstige Länder | Deutsche mit Migrationshintergrund und Ausländer | ||||||||
| Anzahl | % | Anzahl | % | Anzahl | % | Anzahl | % | Anzahl | % | Anzahl | % | Anzahl | % | |
| 2006 | 4.725 | 7,9 | 1.638 | 2,7 | 1.277 | 2,1 | 1.403 | 2,3 | 1.388 | 2,3 | 10.826 | 18,0 | 21.257 | 35,4 |
| 2007 | 4.642 | 7,8 | 1.646 | 2,7 | 1.263 | 2,1 | 1.402 | 2,3 | 1.381 | 2,3 | 10.689 | 17,9 | 21.023 | 35,1 |
| 2008 | 4.526 | 7,6 | 1.634 | 2,7 | 1.208 | 2,0 | 1.408 | 2,4 | 1.400 | 2,3 | 10.726 | 18,0 | 20.902 | 35,1 |
| 2009 | 4.489 | 7,5 | 1.616 | 2,7 | 1.198 | 2,0 | 1.450 | 2,4 | 1.306 | 2,2 | 10.741 | 18,0 | 20.800 | 34,9 |
| 2010 | 4.338 | 7,2 | 1.582 | 2,6 | 1.206 | 2,0 | 1.458 | 2,4 | 1.248 | 2,1 | 11.330 | 18,8 | 21.162 | 35,2 |
| 2011 | 4.343 | 7,1 | 1.640 | 2,7 | 1.276 | 2,1 | 1.469 | 2,4 | 1.325 | 2,2 | 11.749 | 19,3 | 21.802 | 35,8 |
| 2012 | 4.256 | 6,9 | 1.717 | 2,8 | 1.358 | 2,2 | 1.445 | 2,3 | 1.409 | 2,3 | 12.273 | 19,9 | 22.458 | 36,4 |
| 2013 | 4.137 | 6,6 | 1.789 | 2,9 | 1.476 | 2,4 | 1.499 | 2,4 | 1.560 | 2,5 | 12.977 | 20,7 | 23.438 | 37,4 |
| 2014 | 4.044 | 6,3 | 2.067 | 3,2 | 1.565 | 2,4 | 1.527 | 2,4 | 1.611 | 2,5 | 13.707 | 21,4 | 24.521 | 38,4 |
| 2015 | 3.991 | 6,1 | 2.216 | 3,4 | 1.657 | 2,5 | 1.515 | 2,3 | 1.705 | 2,6 | 14.197 | 21,8 | 25.281 | 38,9 |
| 2016 | 3.945 | 5,9 | 2.367 | 3,6 | 1.720 | 2,6 | 1.564 | 2,3 | 1.674 | 2,5 | 15.065 | 22,6 | 26.335 | 39,6 |
| 2017 | 3.899 | 5,8 | 2.406 | 3,6 | 1.721 | 2,6 | 1.550 | 2,3 | 1.416 | 2,1 | 15.748 | 23,5 | 26.740 | 39,9 |
| 2018 | 3.832 | 5,7 | 2.498 | 3,7 | 1.754 | 2,6 | 1.501 | 2,2 | 1.366 | 2,0 | 16.289 | 24,1 | 27.240 | 40,4 |
| 2019 | 3.850 | 5,7 | 2.580 | 3,8 | 1.792 | 2,6 | 1.499 | 2,2 | 1.338 | 2,0 | 16.901 | 24,8 | 27.960 | 41,1 |
| 2020 | 3.873 | 5,7 | 2.600 | 3,8 | 1.822 | 2,7 | 1.501 | 2,2 | 1.301 | 1,9 | 17.139 | 25,1 | 28.236 | 41,4 |
| 2021 | 3.816 | 5,6 | 2.595 | 3,8 | 1.831 | 2,7 | 1.520 | 2,2 | 1.249 | 1,8 | 17.468 | 25,6 | 28.479 | 41,8 |
| 2022 | 3.767 | 5,4 | 2.636 | 3,8 | 1.816 | 2,6 | 1.551 | 2,2 | 1.228 | 1,8 | 19.050 | 27,4 | 30.048 | 43,3 |
| 2023 | . | . | . | . | 1.809 | 2,6 | . | . | 1.203 | 1,7 | 27.878 | 39,9 | 30.890 | 44,3 |
| Türkei | Rumänien | Italien | |||
| Russische Föderation | Polen |

Adresssuche
