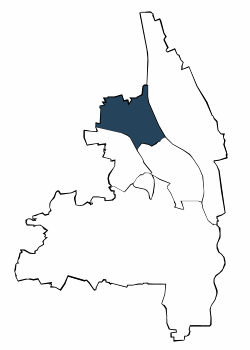
| Jahr | die 5 durchschnittlich häufigsten Bezugsländer | |||||||||||||
| Türkei | Rumänien | Russische Föderation | Polen | Irak | Sonstige Länder | Deutsche mit Migrationshintergrund und Ausländer | ||||||||
| Anzahl | % | Anzahl | % | Anzahl | % | Anzahl | % | Anzahl | % | Anzahl | % | Anzahl | % | |
| 2006 | 3.858 | 12,4 | 1.668 | 5,4 | 1.038 | 3,3 | 867 | 2,8 | 492 | 1,6 | 6.583 | 21,2 | 14.506 | 46,7 |
| 2007 | 3.824 | 12,3 | 1.672 | 5,4 | 1.100 | 3,5 | 884 | 2,8 | 481 | 1,5 | 6.668 | 21,4 | 14.629 | 47,0 |
| 2008 | 3.785 | 12,2 | 1.715 | 5,5 | 1.124 | 3,6 | 871 | 2,8 | 515 | 1,7 | 6.812 | 21,9 | 14.822 | 47,6 |
| 2009 | 3.820 | 12,3 | 1.702 | 5,5 | 1.115 | 3,6 | 810 | 2,6 | 557 | 1,8 | 6.807 | 21,9 | 14.811 | 47,8 |
| 2010 | 3.740 | 12,1 | 1.750 | 5,6 | 1.099 | 3,5 | 792 | 2,6 | 628 | 2,0 | 6.916 | 22,3 | 14.925 | 48,2 |
| 2011 | 3.699 | 11,9 | 1.772 | 5,7 | 1.106 | 3,5 | 810 | 2,6 | 681 | 2,2 | 7.274 | 23,3 | 15.342 | 49,2 |
| 2012 | 3.597 | 11,3 | 1.974 | 6,2 | 1.125 | 3,5 | 902 | 2,8 | 748 | 2,4 | 7.776 | 24,4 | 16.122 | 50,7 |
| 2013 | 3.572 | 10,9 | 2.274 | 6,9 | 1.112 | 3,4 | 980 | 3,0 | 809 | 2,5 | 8.597 | 26,2 | 17.344 | 52,9 |
| 2014 | 3.570 | 10,6 | 2.640 | 7,8 | 1.144 | 3,4 | 1.046 | 3,1 | 862 | 2,6 | 9.243 | 27,3 | 18.505 | 54,7 |
| 2015 | 3.526 | 10,2 | 2.926 | 8,5 | 1.145 | 3,3 | 1.086 | 3,1 | 881 | 2,6 | 9.986 | 28,9 | 19.550 | 56,6 |
| 2016 | 3.449 | 9,8 | 3.130 | 8,9 | 1.107 | 3,1 | 1.030 | 2,9 | 1.010 | 2,9 | 10.811 | 30,7 | 20.537 | 58,3 |
| 2017 | 3.442 | 9,6 | 3.360 | 9,4 | 1.119 | 3,1 | 1.034 | 2,9 | 1.077 | 3,0 | 11.250 | 31,5 | 21.282 | 59,6 |
| 2018 | 3.421 | 9,4 | 3.604 | 10,0 | 1.119 | 3,1 | 995 | 2,7 | 1.116 | 3,1 | 11.786 | 32,5 | 22.041 | 60,9 |
| 2019 | 3.369 | 9,3 | 3.686 | 10,2 | 1.102 | 3,0 | 1.054 | 2,9 | 1.167 | 3,2 | 12.037 | 33,2 | 22.415 | 61,7 |
| 2020 | 3.352 | 9,2 | 3.826 | 10,5 | 1.128 | 3,1 | 995 | 2,7 | 1.148 | 3,2 | 12.169 | 33,5 | 22.618 | 62,3 |
| 2021 | 3.248 | 9,0 | 3.843 | 10,6 | 1.070 | 3,0 | 960 | 2,7 | 1.171 | 3,2 | 12.434 | 34,4 | 22.726 | 62,8 |
| 2022 | 3.271 | 8,9 | 3.823 | 10,4 | 1.071 | 2,9 | 924 | 2,5 | 1.161 | 3,1 | 13.506 | 36,6 | 23.756 | 64,3 |
| 2023 | 3.217 | 8,7 | 3.710 | 10,0 | 1.077 | 2,9 | 907 | 2,4 | 1.139 | 3,1 | 14.115 | 38,1 | 24.165 | 65,2 |
| 2024 | 3.234 | 8,6 | 3.666 | 9,7 | 1.070 | 2,8 | 855 | 2,3 | 1.130 | 3,0 | 14.913 | 39,6 | 24.868 | 66,1 |
| Türkei | Rumänien | Russische Föderation | |||
| Polen | Irak |

Adresssuche
