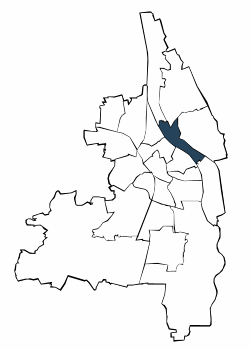
| Jahr | die 5 durchschnittlich häufigsten Bezugsländer | |||||||||||||
| Türkei | Rumänien | Russische Föderation | Kasachstan | Polen | Sonstige Länder | Deutsche mit Migrationshintergrund und Ausländer | ||||||||
| Anzahl | % | Anzahl | % | Anzahl | % | Anzahl | % | Anzahl | % | Anzahl | % | Anzahl | % | |
| 2006 | 2.656 | 12,8 | 1.860 | 9,0 | 682 | 3,3 | 712 | 3,4 | 618 | 3,0 | 4.245 | 20,4 | 10.773 | 51,9 |
| 2007 | 2.699 | 13,1 | 1.862 | 9,0 | 695 | 3,4 | 686 | 3,3 | 616 | 3,0 | 4.218 | 20,5 | 10.776 | 52,3 |
| 2008 | 2.705 | 13,3 | 1.838 | 9,0 | 657 | 3,2 | 666 | 3,3 | 604 | 3,0 | 4.140 | 20,4 | 10.610 | 52,2 |
| 2009 | 2.837 | 13,8 | 1.825 | 8,9 | 644 | 3,1 | 664 | 3,2 | 585 | 2,9 | 4.265 | 20,8 | 10.820 | 52,8 |
| 2010 | 2.762 | 13,4 | 1.792 | 8,7 | 689 | 3,4 | 683 | 3,3 | 594 | 2,9 | 4.384 | 21,3 | 10.904 | 53,0 |
| 2011 | 2.759 | 13,3 | 1.889 | 9,1 | 671 | 3,2 | 688 | 3,3 | 600 | 2,9 | 4.576 | 22,0 | 11.183 | 53,8 |
| 2012 | 2.768 | 13,2 | 1.965 | 9,3 | 700 | 3,3 | 674 | 3,2 | 612 | 2,9 | 4.829 | 23,0 | 11.548 | 54,9 |
| 2013 | 2.789 | 13,1 | 2.029 | 9,5 | 721 | 3,4 | 669 | 3,1 | 671 | 3,1 | 5.048 | 23,7 | 11.927 | 55,9 |
| 2014 | 2.767 | 12,6 | 2.203 | 10,1 | 721 | 3,3 | 676 | 3,1 | 721 | 3,3 | 5.407 | 24,7 | 12.495 | 57,1 |
| 2015 | 2.710 | 12,1 | 2.406 | 10,7 | 713 | 3,2 | 690 | 3,1 | 716 | 3,2 | 5.810 | 25,9 | 13.045 | 58,1 |
| 2016 | 2.720 | 12,0 | 2.460 | 10,8 | 703 | 3,1 | 690 | 3,0 | 727 | 3,2 | 6.085 | 26,8 | 13.385 | 59,0 |
| 2017 | 2.674 | 11,7 | 2.560 | 11,2 | 703 | 3,1 | 676 | 3,0 | 722 | 3,2 | 6.430 | 28,1 | 13.765 | 60,2 |
| 2018 | 2.675 | 11,6 | 2.652 | 11,5 | 720 | 3,1 | 669 | 2,9 | 711 | 3,1 | 6.663 | 28,9 | 14.090 | 61,1 |
| 2019 | 2.596 | 11,3 | 2.633 | 11,5 | 732 | 3,2 | 648 | 2,8 | 701 | 3,1 | 6.907 | 30,1 | 14.217 | 62,0 |
| 2020 | 2.527 | 11,0 | 2.666 | 11,6 | 714 | 3,1 | 643 | 2,8 | 693 | 3,0 | 7.119 | 31,0 | 14.362 | 62,6 |
| 2021 | 2.489 | 10,8 | 2.720 | 11,8 | 704 | 3,1 | 640 | 2,8 | 670 | 2,9 | 7.344 | 31,9 | 14.567 | 63,2 |
| 2022 | 2.414 | 10,4 | 2.745 | 11,9 | 692 | 3,0 | 623 | 2,7 | 671 | 2,9 | 7.667 | 33,1 | 14.812 | 64,0 |
| 2023 | 2.392 | 10,3 | 2.702 | 11,7 | 687 | 3,0 | 602 | 2,6 | 673 | 2,9 | 7.915 | 34,2 | 14.971 | 64,7 |
| 2024 | 2.393 | 10,4 | 2.663 | 11,5 | 673 | 2,9 | 588 | 2,5 | 638 | 2,8 | 8.124 | 35,2 | 15.079 | 65,3 |
| Türkei | Rumänien | Russische Föderation | |||
| Kasachstan | Polen |

Adresssuche
