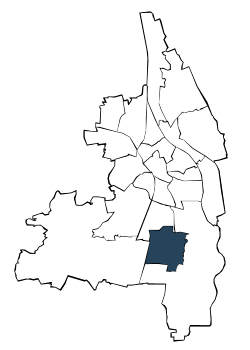
| Jahr | die 5 durchschnittlich häufigsten Bezugsländer | |||||||||||||
| Türkei | Rumänien | Polen | Kasachstan | Russische Föderation | Sonstige Länder | Deutsche mit Migrationshintergrund und Ausländer | ||||||||
| Anzahl | % | Anzahl | % | Anzahl | % | Anzahl | % | Anzahl | % | Anzahl | % | Anzahl | % | |
| 2006 | 1.429 | 7,3 | 766 | 3,9 | 714 | 3,6 | 470 | 2,4 | 415 | 2,1 | 2.598 | 13,2 | 6.392 | 32,5 |
| 2007 | 1.426 | 7,2 | 799 | 4,1 | 702 | 3,6 | 520 | 2,6 | 436 | 2,2 | 2.614 | 13,3 | 6.497 | 33,0 |
| 2008 | 1.451 | 7,4 | 797 | 4,0 | 655 | 3,3 | 531 | 2,7 | 449 | 2,3 | 2.646 | 13,4 | 6.529 | 33,2 |
| 2009 | 1.447 | 7,4 | 795 | 4,1 | 652 | 3,3 | 559 | 2,9 | 486 | 2,5 | 2.566 | 13,1 | 6.505 | 33,3 |
| 2010 | 1.476 | 7,6 | 780 | 4,0 | 656 | 3,4 | 556 | 2,9 | 504 | 2,6 | 2.562 | 13,2 | 6.534 | 33,6 |
| 2011 | 1.487 | 7,5 | 782 | 4,0 | 635 | 3,2 | 561 | 2,8 | 525 | 2,7 | 2.662 | 13,5 | 6.652 | 33,8 |
| 2012 | 1.503 | 7,6 | 785 | 4,0 | 643 | 3,2 | 569 | 2,9 | 539 | 2,7 | 2.702 | 13,7 | 6.741 | 34,1 |
| 2013 | 1.465 | 7,4 | 838 | 4,2 | 668 | 3,4 | 588 | 3,0 | 547 | 2,8 | 2.860 | 14,4 | 6.966 | 35,1 |
| 2014 | 1.475 | 7,3 | 909 | 4,5 | 708 | 3,5 | 594 | 3,0 | 572 | 2,8 | 3.012 | 15,0 | 7.270 | 36,2 |
| 2015 | 1.467 | 7,3 | 943 | 4,7 | 727 | 3,6 | 576 | 2,8 | 573 | 2,8 | 3.212 | 15,9 | 7.498 | 37,1 |
| 2016 | 1.465 | 7,1 | 985 | 4,8 | 729 | 3,5 | 613 | 3,0 | 603 | 2,9 | 3.497 | 17,0 | 7.892 | 38,3 |
| 2017 | 1.452 | 7,0 | 1.023 | 4,9 | 758 | 3,7 | 633 | 3,1 | 605 | 2,9 | 3.640 | 17,6 | 8.111 | 39,2 |
| 2018 | 1.518 | 7,3 | 1.042 | 5,0 | 740 | 3,5 | 642 | 3,1 | 648 | 3,1 | 3.763 | 18,0 | 8.353 | 39,9 |
| 2019 | 1.541 | 7,3 | 1.055 | 5,0 | 727 | 3,5 | 619 | 2,9 | 665 | 3,2 | 3.964 | 18,8 | 8.571 | 40,7 |
| 2020 | 1.575 | 7,5 | 1.051 | 5,0 | 701 | 3,3 | 632 | 3,0 | 661 | 3,2 | 4.057 | 19,3 | 8.677 | 41,4 |
| 2021 | 1.569 | 7,4 | 1.064 | 5,0 | 670 | 3,2 | 640 | 3,0 | 693 | 3,3 | 4.218 | 20,0 | 8.854 | 42,0 |
| 2022 | 1.609 | 7,5 | 1.076 | 5,0 | 675 | 3,2 | 639 | 3,0 | 698 | 3,3 | 4.632 | 21,6 | 9.329 | 43,6 |
| 2023 | . | . | . | . | 679 | 3,2 | 636 | 3,0 | . | . | 8.171 | 38,1 | 9.486 | 44,2 |
| Türkei | Rumänien | Polen | |||
| Kasachstan | Russische Föderation |

Adresssuche
