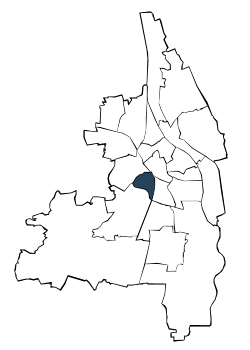
| Jahr | die 5 durchschnittlich häufigsten Bezugsländer | |||||||||||||
| Rumänien | Türkei | Russische Föderation | Italien | Polen | Sonstige Länder | Deutsche mit Migrationshintergrund und Ausländer | ||||||||
| Anzahl | % | Anzahl | % | Anzahl | % | Anzahl | % | Anzahl | % | Anzahl | % | Anzahl | % | |
| 2006 | 180 | 2,9 | 158 | 2,6 | 105 | 1,7 | 85 | 1,4 | 117 | 1,9 | 1.130 | 18,3 | 1.775 | 28,8 |
| 2007 | 162 | 2,6 | 153 | 2,5 | 118 | 1,9 | 88 | 1,4 | 120 | 1,9 | 1.161 | 18,6 | 1.802 | 28,9 |
| 2008 | 157 | 2,6 | 141 | 2,3 | 106 | 1,7 | 89 | 1,5 | 121 | 2,0 | 1.146 | 18,7 | 1.760 | 28,7 |
| 2009 | 160 | 2,7 | 157 | 2,6 | 114 | 1,9 | 84 | 1,4 | 111 | 1,8 | 1.114 | 18,5 | 1.740 | 28,9 |
| 2010 | 154 | 2,5 | 151 | 2,5 | 107 | 1,8 | 85 | 1,4 | 107 | 1,8 | 1.217 | 20,0 | 1.821 | 29,9 |
| 2011 | 152 | 2,5 | 170 | 2,8 | 102 | 1,7 | 94 | 1,5 | 110 | 1,8 | 1.297 | 21,1 | 1.925 | 31,3 |
| 2012 | 161 | 2,6 | 163 | 2,6 | 106 | 1,7 | 91 | 1,5 | 111 | 1,8 | 1.361 | 21,9 | 1.993 | 32,0 |
| 2013 | 157 | 2,5 | 168 | 2,7 | 116 | 1,9 | 103 | 1,7 | 111 | 1,8 | 1.429 | 23,0 | 2.084 | 33,6 |
| 2014 | 186 | 3,0 | 159 | 2,5 | 110 | 1,7 | 115 | 1,8 | 96 | 1,5 | 1.404 | 22,3 | 2.070 | 32,9 |
| 2015 | 197 | 3,1 | 163 | 2,6 | 100 | 1,6 | 111 | 1,8 | 110 | 1,7 | 1.362 | 21,5 | 2.043 | 32,3 |
| 2016 | 193 | 3,0 | 179 | 2,8 | 108 | 1,7 | 120 | 1,9 | 118 | 1,8 | 1.345 | 21,1 | 2.063 | 32,3 |
| 2017 | 183 | 2,9 | 172 | 2,8 | 107 | 1,7 | 119 | 1,9 | 111 | 1,8 | 1.302 | 21,0 | 1.994 | 32,1 |
| 2018 | 186 | 3,0 | 182 | 2,9 | 115 | 1,8 | 115 | 1,8 | 100 | 1,6 | 1.326 | 21,3 | 2.024 | 32,5 |
| 2019 | 199 | 3,2 | 174 | 2,8 | 115 | 1,9 | 118 | 1,9 | 94 | 1,5 | 1.326 | 21,4 | 2.026 | 32,6 |
| 2020 | 197 | 3,2 | 168 | 2,7 | 120 | 1,9 | 123 | 2,0 | 101 | 1,6 | 1.307 | 21,1 | 2.016 | 32,5 |
| 2021 | 200 | 3,2 | 178 | 2,9 | 128 | 2,1 | 115 | 1,9 | 99 | 1,6 | 1.372 | 22,3 | 2.092 | 34,0 |
| 2022 | 198 | 3,0 | 214 | 3,2 | 138 | 2,1 | 125 | 1,9 | 100 | 1,5 | 1.699 | 25,7 | 2.474 | 37,4 |
| 2023 | 190 | 2,8 | 239 | 3,5 | 134 | 2,0 | 135 | 2,0 | 99 | 1,5 | 1.807 | 26,8 | 2.604 | 38,7 |
| 2024 | 185 | 2,8 | 231 | 3,4 | 126 | 1,9 | 149 | 2,2 | 94 | 1,4 | 1.783 | 26,5 | 2.568 | 38,2 |
| Rumänien | Türkei | Russische Föderation | |||
| Italien | Polen |

Adresssuche
