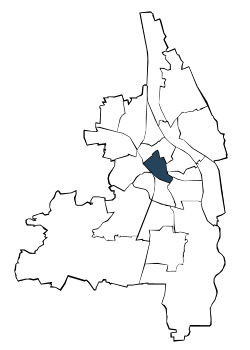
| Jahr | die 5 durchschnittlich häufigsten Bezugsländer | |||||||||||||
| Türkei | Italien | Rumänien | Polen | Russische Föderation | Sonstige Länder | Deutsche mit Migrationshintergrund und Ausländer | ||||||||
| Anzahl | % | Anzahl | % | Anzahl | % | Anzahl | % | Anzahl | % | Anzahl | % | Anzahl | % | |
| 2006 | 759 | 5,6 | 282 | 2,1 | 294 | 2,2 | 305 | 2,3 | 240 | 1,8 | 2.007 | 14,9 | 3.887 | 28,8 |
| 2007 | 754 | 5,5 | 275 | 2,0 | 292 | 2,1 | 310 | 2,3 | 231 | 1,7 | 2.142 | 15,6 | 4.004 | 29,1 |
| 2008 | 739 | 5,3 | 254 | 1,8 | 285 | 2,1 | 302 | 2,2 | 224 | 1,6 | 2.203 | 15,9 | 4.007 | 28,9 |
| 2009 | 726 | 5,2 | 273 | 1,9 | 294 | 2,1 | 268 | 1,9 | 235 | 1,7 | 2.310 | 16,4 | 4.106 | 29,2 |
| 2010 | 675 | 4,7 | 275 | 1,9 | 277 | 1,9 | 259 | 1,8 | 240 | 1,7 | 2.470 | 17,4 | 4.196 | 29,5 |
| 2011 | 667 | 4,6 | 282 | 2,0 | 292 | 2,0 | 258 | 1,8 | 245 | 1,7 | 2.476 | 17,3 | 4.220 | 29,4 |
| 2012 | 671 | 4,6 | 312 | 2,2 | 290 | 2,0 | 278 | 1,9 | 249 | 1,7 | 2.535 | 17,5 | 4.335 | 29,9 |
| 2013 | 633 | 4,3 | 327 | 2,2 | 295 | 2,0 | 272 | 1,9 | 271 | 1,8 | 2.623 | 17,9 | 4.421 | 30,1 |
| 2014 | 596 | 4,0 | 358 | 2,4 | 328 | 2,2 | 283 | 1,9 | 257 | 1,7 | 2.776 | 18,8 | 4.598 | 31,1 |
| 2015 | 600 | 4,0 | 361 | 2,4 | 328 | 2,2 | 263 | 1,8 | 257 | 1,7 | 2.841 | 19,0 | 4.650 | 31,0 |
| 2016 | 578 | 3,7 | 379 | 2,4 | 376 | 2,4 | 250 | 1,6 | 274 | 1,7 | 3.188 | 20,2 | 5.045 | 31,9 |
| 2017 | 602 | 3,7 | 397 | 2,5 | 374 | 2,3 | 260 | 1,6 | 268 | 1,7 | 3.385 | 20,9 | 5.286 | 32,7 |
| 2018 | 609 | 3,7 | 440 | 2,7 | 374 | 2,3 | 261 | 1,6 | 259 | 1,6 | 3.482 | 21,3 | 5.425 | 33,2 |
| 2019 | 606 | 3,7 | 428 | 2,6 | 393 | 2,4 | 265 | 1,6 | 261 | 1,6 | 3.579 | 22,0 | 5.532 | 34,0 |
| 2020 | 599 | 3,7 | 410 | 2,5 | 372 | 2,3 | 255 | 1,6 | 269 | 1,7 | 3.501 | 21,8 | 5.406 | 33,6 |
| 2021 | 597 | 3,7 | 417 | 2,6 | 365 | 2,3 | 253 | 1,6 | 273 | 1,7 | 3.597 | 22,3 | 5.502 | 34,2 |
| 2022 | 576 | 3,5 | 401 | 2,5 | 388 | 2,4 | 247 | 1,5 | 278 | 1,7 | 3.961 | 24,3 | 5.851 | 36,0 |
| 2023 | . | . | 410 | 2,5 | . | . | 242 | 1,5 | . | . | 5.519 | 33,5 | 6.171 | 37,5 |
| Türkei | Italien | Rumänien | |||
| Polen | Russische Föderation |

Adresssuche
