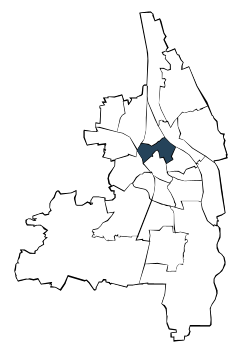
| Jahr | die 5 durchschnittlich häufigsten Bezugsländer | |||||||||||||
| Türkei | Rumänien | Italien | Polen | Kroatien | Sonstige Länder | Deutsche mit Migrationshintergrund und Ausländer | ||||||||
| Anzahl | % | Anzahl | % | Anzahl | % | Anzahl | % | Anzahl | % | Anzahl | % | Anzahl | % | |
| 2006 | 1.173 | 5,9 | 509 | 2,5 | 403 | 2,0 | 395 | 2,0 | 208 | 1,0 | 3.485 | 17,4 | 6.173 | 30,9 |
| 2007 | 1.153 | 5,8 | 508 | 2,6 | 405 | 2,0 | 379 | 1,9 | 195 | 1,0 | 3.456 | 17,4 | 6.096 | 30,7 |
| 2008 | 1.064 | 5,4 | 512 | 2,6 | 396 | 2,0 | 375 | 1,9 | 194 | 1,0 | 3.474 | 17,6 | 6.015 | 30,5 |
| 2009 | 1.041 | 5,3 | 495 | 2,5 | 370 | 1,9 | 403 | 2,1 | 192 | 1,0 | 3.475 | 17,7 | 5.976 | 30,4 |
| 2010 | 1.033 | 5,2 | 493 | 2,5 | 366 | 1,9 | 373 | 1,9 | 194 | 1,0 | 3.560 | 18,1 | 6.019 | 30,5 |
| 2011 | 1.009 | 5,1 | 520 | 2,6 | 395 | 2,0 | 381 | 1,9 | 187 | 0,9 | 3.737 | 18,8 | 6.229 | 31,3 |
| 2012 | 1.004 | 5,0 | 576 | 2,8 | 447 | 2,2 | 405 | 2,0 | 186 | 0,9 | 3.891 | 19,2 | 6.509 | 32,2 |
| 2013 | 969 | 4,7 | 615 | 3,0 | 499 | 2,4 | 471 | 2,3 | 205 | 1,0 | 4.177 | 20,2 | 6.936 | 33,6 |
| 2014 | 979 | 4,7 | 668 | 3,2 | 527 | 2,5 | 499 | 2,4 | 236 | 1,1 | 4.462 | 21,3 | 7.371 | 35,2 |
| 2015 | 960 | 4,5 | 741 | 3,5 | 558 | 2,6 | 511 | 2,4 | 277 | 1,3 | 4.746 | 22,2 | 7.793 | 36,5 |
| 2016 | 955 | 4,4 | 793 | 3,7 | 586 | 2,7 | 476 | 2,2 | 328 | 1,5 | 4.915 | 22,8 | 8.053 | 37,3 |
| 2017 | 920 | 4,2 | 794 | 3,7 | 582 | 2,7 | 461 | 2,1 | 384 | 1,8 | 5.170 | 23,8 | 8.311 | 38,2 |
| 2018 | 925 | 4,2 | 805 | 3,7 | 567 | 2,6 | 449 | 2,1 | 475 | 2,2 | 5.287 | 24,2 | 8.508 | 38,9 |
| 2019 | 930 | 4,2 | 806 | 3,6 | 600 | 2,7 | 436 | 2,0 | 535 | 2,4 | 5.471 | 24,7 | 8.778 | 39,6 |
| 2020 | 941 | 4,3 | 816 | 3,7 | 634 | 2,9 | 424 | 1,9 | 543 | 2,5 | 5.528 | 25,0 | 8.886 | 40,2 |
| 2021 | 921 | 4,2 | 811 | 3,7 | 627 | 2,8 | 417 | 1,9 | 525 | 2,4 | 5.709 | 25,8 | 9.010 | 40,7 |
| 2022 | 880 | 3,9 | 810 | 3,6 | 630 | 2,8 | 413 | 1,8 | 520 | 2,3 | 6.225 | 27,7 | 9.478 | 42,2 |
| 2023 | . | . | . | . | 607 | 2,7 | 416 | 1,9 | 516 | 2,3 | 8.003 | 35,9 | 9.542 | 42,8 |
| Türkei | Rumänien | Italien | |||
| Polen | Kroatien |

Adresssuche
