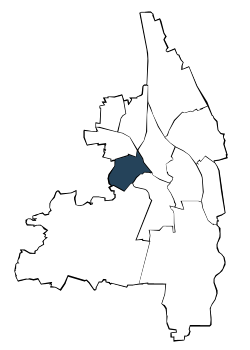
| Jahr | die 5 durchschnittlich häufigsten Bezugsländer | |||||||||||||
| Türkei | Rumänien | Polen | Kroatien | Russische Föderation | Sonstige Länder | Deutsche mit Migrationshintergrund und Ausländer | ||||||||
| Anzahl | % | Anzahl | % | Anzahl | % | Anzahl | % | Anzahl | % | Anzahl | % | Anzahl | % | |
| 2006 | 1.710 | 7,4 | 869 | 3,7 | 607 | 2,6 | 402 | 1,7 | 496 | 2,1 | 4.214 | 18,2 | 8.298 | 35,8 |
| 2007 | 1.747 | 7,5 | 876 | 3,8 | 584 | 2,5 | 384 | 1,6 | 528 | 2,3 | 4.197 | 18,0 | 8.316 | 35,7 |
| 2008 | 1.736 | 7,4 | 864 | 3,7 | 568 | 2,4 | 378 | 1,6 | 540 | 2,3 | 4.247 | 18,1 | 8.333 | 35,6 |
| 2009 | 1.756 | 7,4 | 897 | 3,8 | 563 | 2,4 | 384 | 1,6 | 531 | 2,2 | 4.214 | 17,8 | 8.345 | 35,3 |
| 2010 | 1.706 | 7,1 | 896 | 3,7 | 543 | 2,3 | 361 | 1,5 | 522 | 2,2 | 4.354 | 18,2 | 8.382 | 35,0 |
| 2011 | 1.726 | 7,1 | 925 | 3,8 | 571 | 2,3 | 351 | 1,4 | 532 | 2,2 | 4.480 | 18,4 | 8.585 | 35,2 |
| 2012 | 1.721 | 6,8 | 969 | 3,9 | 586 | 2,3 | 364 | 1,4 | 546 | 2,2 | 4.841 | 19,3 | 9.027 | 35,9 |
| 2013 | 1.684 | 6,6 | 1.053 | 4,1 | 602 | 2,4 | 375 | 1,5 | 548 | 2,1 | 5.052 | 19,7 | 9.314 | 36,4 |
| 2014 | 1.687 | 6,5 | 1.065 | 4,1 | 623 | 2,4 | 431 | 1,7 | 567 | 2,2 | 5.272 | 20,2 | 9.645 | 37,0 |
| 2015 | 1.667 | 6,3 | 1.122 | 4,2 | 669 | 2,5 | 513 | 1,9 | 591 | 2,2 | 5.555 | 20,9 | 10.117 | 38,1 |
| 2016 | 1.659 | 6,1 | 1.204 | 4,5 | 672 | 2,5 | 583 | 2,2 | 610 | 2,3 | 5.881 | 21,8 | 10.609 | 39,3 |
| 2017 | 1.666 | 6,1 | 1.225 | 4,5 | 684 | 2,5 | 692 | 2,5 | 606 | 2,2 | 5.981 | 22,0 | 10.854 | 40,0 |
| 2018 | 1.649 | 6,1 | 1.211 | 4,5 | 658 | 2,4 | 745 | 2,7 | 611 | 2,2 | 6.116 | 22,5 | 10.990 | 40,4 |
| 2019 | 1.655 | 6,1 | 1.216 | 4,5 | 639 | 2,3 | 780 | 2,9 | 609 | 2,2 | 6.355 | 23,3 | 11.254 | 41,2 |
| 2020 | 1.617 | 6,0 | 1.228 | 4,5 | 638 | 2,4 | 798 | 2,9 | 572 | 2,1 | 6.331 | 23,4 | 11.184 | 41,3 |
| 2021 | 1.590 | 5,9 | 1.218 | 4,5 | 602 | 2,2 | 834 | 3,1 | 547 | 2,0 | 6.417 | 23,9 | 11.208 | 41,8 |
| 2022 | 1.610 | 5,9 | 1.272 | 4,7 | 607 | 2,2 | 821 | 3,0 | 555 | 2,0 | 6.939 | 25,5 | 11.804 | 43,4 |
| 2023 | . | . | . | . | 599 | 2,2 | 830 | 3,0 | . | . | 10.662 | 38,9 | 12.091 | 44,1 |
| Türkei | Rumänien | Polen | |||
| Kroatien | Russische Föderation |

Adresssuche
