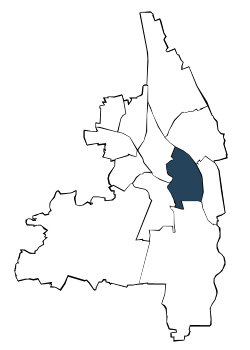
| Jahr | die 5 durchschnittlich häufigsten Bezugsländer | |||||||||||||
| Türkei | Rumänien | Russische Föderation | Kasachstan | Polen | Sonstige Länder | Deutsche mit Migrationshintergrund und Ausländer | ||||||||
| Anzahl | % | Anzahl | % | Anzahl | % | Anzahl | % | Anzahl | % | Anzahl | % | Anzahl | % | |
| 2006 | 2.635 | 13,0 | 655 | 3,2 | 831 | 4,1 | 789 | 3,9 | 571 | 2,8 | 3.941 | 19,4 | 9.422 | 46,3 |
| 2007 | 2.582 | 12,9 | 684 | 3,4 | 806 | 4,0 | 755 | 3,8 | 572 | 2,9 | 3.722 | 18,6 | 9.121 | 45,6 |
| 2008 | 2.582 | 13,0 | 680 | 3,4 | 830 | 4,2 | 745 | 3,7 | 602 | 3,0 | 3.681 | 18,5 | 9.120 | 45,8 |
| 2009 | 2.565 | 12,9 | 667 | 3,4 | 859 | 4,3 | 740 | 3,7 | 524 | 2,6 | 3.623 | 18,3 | 8.978 | 45,2 |
| 2010 | 2.479 | 12,3 | 658 | 3,3 | 884 | 4,4 | 761 | 3,8 | 509 | 2,5 | 3.835 | 19,1 | 9.126 | 45,4 |
| 2011 | 2.497 | 12,2 | 676 | 3,3 | 884 | 4,3 | 774 | 3,8 | 576 | 2,8 | 4.021 | 19,7 | 9.428 | 46,1 |
| 2012 | 2.418 | 11,6 | 690 | 3,3 | 858 | 4,1 | 759 | 3,6 | 615 | 3,0 | 4.281 | 20,6 | 9.621 | 46,2 |
| 2013 | 2.367 | 11,2 | 722 | 3,4 | 852 | 4,0 | 762 | 3,6 | 706 | 3,3 | 4.588 | 21,6 | 9.997 | 47,1 |
| 2014 | 2.310 | 10,5 | 885 | 4,0 | 872 | 4,0 | 747 | 3,4 | 733 | 3,3 | 4.935 | 22,5 | 10.482 | 47,8 |
| 2015 | 2.268 | 10,2 | 950 | 4,3 | 850 | 3,8 | 707 | 3,2 | 821 | 3,7 | 5.199 | 23,3 | 10.795 | 48,3 |
| 2016 | 2.233 | 9,8 | 1.005 | 4,4 | 865 | 3,8 | 699 | 3,1 | 830 | 3,6 | 5.542 | 24,3 | 11.174 | 49,0 |
| 2017 | 2.205 | 9,7 | 1.055 | 4,6 | 872 | 3,8 | 672 | 2,9 | 584 | 2,6 | 5.761 | 25,3 | 11.149 | 48,9 |
| 2018 | 2.116 | 9,2 | 1.133 | 4,9 | 844 | 3,7 | 664 | 2,9 | 556 | 2,4 | 5.970 | 25,9 | 11.283 | 48,9 |
| 2019 | 2.140 | 9,1 | 1.182 | 5,0 | 843 | 3,6 | 672 | 2,9 | 543 | 2,3 | 6.244 | 26,6 | 11.624 | 49,5 |
| 2020 | 2.165 | 9,1 | 1.215 | 5,1 | 827 | 3,5 | 653 | 2,7 | 521 | 2,2 | 6.547 | 27,5 | 11.928 | 50,0 |
| 2021 | 2.120 | 8,9 | 1.219 | 5,1 | 800 | 3,4 | 621 | 2,6 | 480 | 2,0 | 6.635 | 27,9 | 11.875 | 49,9 |
| 2022 | 2.097 | 8,7 | 1.240 | 5,1 | 804 | 3,3 | 600 | 2,5 | 468 | 1,9 | 7.036 | 29,2 | 12.245 | 50,8 |
| 2023 | . | . | . | . | . | . | 612 | 2,5 | 446 | 1,8 | 11.515 | 47,4 | 12.573 | 51,7 |
| Türkei | Rumänien | Russische Föderation | |||
| Kasachstan | Polen |

Adresssuche
