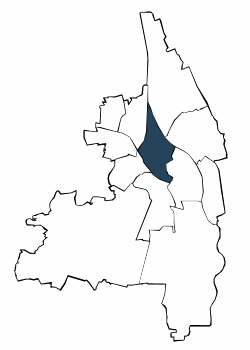
| Jahr | die 5 durchschnittlich häufigsten Bezugsländer | |||||||||||||
| Türkei | Rumänien | Italien | Polen | Russische Föderation | Sonstige Länder | Deutsche mit Migrationshintergrund und Ausländer | ||||||||
| Anzahl | % | Anzahl | % | Anzahl | % | Anzahl | % | Anzahl | % | Anzahl | % | Anzahl | % | |
| 2006 | 2.303 | 6,2 | 920 | 2,5 | 780 | 2,1 | 786 | 2,1 | 498 | 1,3 | 6.237 | 16,7 | 11.524 | 30,9 |
| 2007 | 2.269 | 6,1 | 919 | 2,5 | 774 | 2,1 | 783 | 2,1 | 516 | 1,4 | 6.293 | 16,8 | 11.554 | 30,9 |
| 2008 | 2.148 | 5,8 | 921 | 2,5 | 736 | 2,0 | 763 | 2,0 | 505 | 1,4 | 6.369 | 17,1 | 11.442 | 30,7 |
| 2009 | 2.121 | 5,7 | 913 | 2,4 | 723 | 1,9 | 734 | 2,0 | 507 | 1,4 | 6.436 | 17,2 | 11.434 | 30,6 |
| 2010 | 2.053 | 5,5 | 897 | 2,4 | 715 | 1,9 | 691 | 1,8 | 503 | 1,3 | 6.691 | 17,8 | 11.550 | 30,7 |
| 2011 | 1.986 | 5,2 | 929 | 2,4 | 758 | 2,0 | 704 | 1,9 | 517 | 1,4 | 6.898 | 18,2 | 11.792 | 31,1 |
| 2012 | 1.951 | 5,1 | 1.003 | 2,6 | 830 | 2,2 | 751 | 2,0 | 515 | 1,3 | 7.138 | 18,6 | 12.188 | 31,7 |
| 2013 | 1.859 | 4,7 | 1.064 | 2,7 | 904 | 2,3 | 809 | 2,1 | 566 | 1,4 | 7.684 | 19,6 | 12.886 | 32,9 |
| 2014 | 1.830 | 4,6 | 1.178 | 3,0 | 971 | 2,5 | 860 | 2,2 | 595 | 1,5 | 8.167 | 20,6 | 13.601 | 34,4 |
| 2015 | 1.807 | 4,5 | 1.274 | 3,2 | 1.018 | 2,5 | 866 | 2,1 | 607 | 1,5 | 8.646 | 21,4 | 14.218 | 35,2 |
| 2016 | 1.774 | 4,3 | 1.402 | 3,4 | 1.080 | 2,6 | 807 | 1,9 | 636 | 1,5 | 9.310 | 22,4 | 15.009 | 36,1 |
| 2017 | 1.762 | 4,2 | 1.399 | 3,3 | 1.088 | 2,6 | 798 | 1,9 | 613 | 1,5 | 9.960 | 23,6 | 15.620 | 37,1 |
| 2018 | 1.772 | 4,2 | 1.448 | 3,4 | 1.116 | 2,6 | 780 | 1,8 | 588 | 1,4 | 10.256 | 24,2 | 15.960 | 37,7 |
| 2019 | 1.765 | 4,1 | 1.525 | 3,6 | 1.126 | 2,6 | 772 | 1,8 | 583 | 1,4 | 10.669 | 25,0 | 16.440 | 38,5 |
| 2020 | 1.774 | 4,2 | 1.527 | 3,6 | 1.145 | 2,7 | 748 | 1,8 | 598 | 1,4 | 10.579 | 24,9 | 16.371 | 38,6 |
| 2021 | 1.723 | 4,1 | 1.542 | 3,6 | 1.156 | 2,7 | 741 | 1,7 | 618 | 1,5 | 10.862 | 25,6 | 16.642 | 39,2 |
| 2022 | 1.668 | 3,9 | 1.541 | 3,6 | 1.137 | 2,6 | 727 | 1,7 | 632 | 1,5 | 11.892 | 27,6 | 17.597 | 40,9 |
| 2023 | 1.759 | 4,1 | 1.513 | 3,5 | 1.115 | 2,6 | 726 | 1,7 | 700 | 1,6 | 12.194 | 28,3 | 18.007 | 41,8 |
| 2024 | 1.758 | 4,0 | 1.496 | 3,4 | 1.093 | 2,5 | 716 | 1,6 | 697 | 1,6 | 12.762 | 29,3 | 18.522 | 42,5 |
| Türkei | Rumänien | Italien | |||
| Polen | Russische Föderation |

Adresssuche
