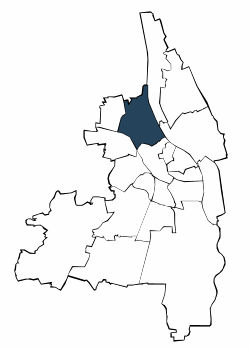
| Jahr | Männer | Frauen | Deutsche | Ausländer | unter 25 Jahre | 25 Jahre und älter | Insgesamt | |||||||||
| Anzahl | % | Anzahl | % | Anzahl | % | Anzahl | % | Anzahl | % | Anzahl | % | Anzahl | % | |||
| 2009 | 4.196 | 55,7 | 3.342 | 44,3 | 5.698 | 75,6 | 1.840 | 24,4 | 1.240 | 16,4 | 6.298 | 83,6 | 7.538 | 100,0 | ||
| 2010 | 4.500 | 57,1 | 3.384 | 42,9 | 5.840 | 74,1 | 2.044 | 25,9 | 1.267 | 16,1 | 6.617 | 83,9 | 7.884 | 100,0 | ||
| 2011 | 4.941 | 57,5 | 3.656 | 42,5 | 6.281 | 73,1 | 2.316 | 26,9 | 1.396 | 16,2 | 7.201 | 83,8 | 8.597 | 100,0 | ||
| 2012 | 5.044 | 57,0 | 3.800 | 43,0 | 6.349 | 71,8 | 2.495 | 28,2 | 1.397 | 15,8 | 7.447 | 84,2 | 8.844 | 100,0 | ||
| 2013 | 5.274 | 57,3 | 3.924 | 42,7 | 6.461 | 70,2 | 2.736 | 29,7 | 1.476 | 16,0 | 7.722 | 84,0 | 9.198 | 100,0 | ||
| 2014 | 5.659 | 58,5 | 4.015 | 41,5 | 6.464 | 66,8 | 3.210 | 33,2 | 1.558 | 16,1 | 8.116 | 83,9 | 9.674 | 100,0 | ||
| 2015 | 6.087 | 59,0 | 4.222 | 41,0 | 6.688 | 64,9 | 3.621 | 35,1 | 1.597 | 15,5 | 8.712 | 84,5 | 10.309 | 100,0 | ||
| 2016 | 6.385 | 59,4 | 4.364 | 40,6 | 6.806 | 63,3 | 3.942 | 36,7 | 1.618 | 15,1 | 9.131 | 84,9 | 10.749 | 100,0 | ||
| 2017 | 6.768 | 60,2 | 4.473 | 39,8 | 6.866 | 61,1 | 4.375 | 38,9 | 1.647 | 14,7 | 9.594 | 85,3 | 11.241 | 100,0 | ||
| 2018 | 7.125 | 60,4 | 4.663 | 39,6 | 6.922 | 58,7 | 4.866 | 41,3 | 1.765 | 15,0 | 10.023 | 85,0 | 11.788 | 100,0 | ||
| 2019 | 7.251 | 60,2 | 4.791 | 39,8 | 6.900 | 57,3 | 5.142 | 42,7 | 1.769 | 14,7 | 10.273 | 85,3 | 12.042 | 100,0 | ||
| 2020 | 7.274 | 60,0 | 4.854 | 40,0 | 6.799 | 56,1 | 5.329 | 43,9 | 1.871 | 15,4 | 10.257 | 84,6 | 12.128 | 100,0 | ||
| 2021 | 7.360 | 60,0 | 4.902 | 40,0 | 6.799 | 55,4 | 5.463 | 44,6 | 1.853 | 15,1 | 10.409 | 84,9 | 12.262 | 100,0 | ||
| 2022 | 7.556 | 60,2 | 4.992 | 39,8 | 6.866 | 54,7 | 5.682 | 45,3 | 1.753 | 14,0 | 10.795 | 86,0 | 12.548 | 100,0 | ||
| 2023 | 7.619 | 59,9 | 5.109 | 40,1 | 6.994 | 54,9 | 5.734 | 45,1 | 1.756 | 13,8 | 10.972 | 86,2 | 12.728 | 100,0 | ||
| Männer | Frauen | Deutsche | Ausländer | ||||
| unter 25 Jahre | 25 Jahre und älter |

Adresssuche
