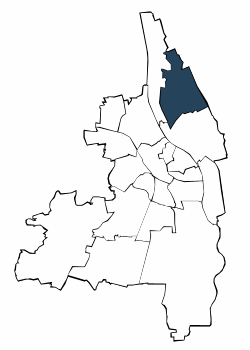
| Jahr | Männer | Frauen | Deutsche | Ausländer | unter 25 Jahre | 25 Jahre und älter | Insgesamt | |||||||||
| Anzahl | % | Anzahl | % | Anzahl | % | Anzahl | % | Anzahl | % | Anzahl | % | Anzahl | % | |||
| 2009 | 1.325 | 55,3 | 1.073 | 44,7 | 2.197 | 91,6 | 201 | 8,4 | 306 | 12,8 | 2.092 | 87,2 | 2.398 | 100,0 | ||
| 2010 | 1.362 | 54,7 | 1.127 | 45,3 | 2.272 | 91,3 | 217 | 8,7 | 330 | 13,3 | 2.159 | 86,7 | 2.489 | 100,0 | ||
| 2011 | 1.427 | 54,6 | 1.185 | 45,4 | 2.374 | 90,9 | 238 | 9,1 | 330 | 12,6 | 2.282 | 87,4 | 2.612 | 100,0 | ||
| 2012 | 1.439 | 54,2 | 1.217 | 45,8 | 2.374 | 89,4 | 282 | 10,6 | 332 | 12,5 | 2.324 | 87,5 | 2.656 | 100,0 | ||
| 2013 | 1.484 | 53,8 | 1.272 | 46,2 | 2.455 | 89,1 | 301 | 10,9 | 332 | 12,0 | 2.424 | 88,0 | 2.756 | 100,0 | ||
| 2014 | 1.475 | 54,1 | 1.252 | 45,9 | 2.405 | 88,2 | 322 | 11,8 | 333 | 12,2 | 2.394 | 87,8 | 2.727 | 100,0 | ||
| 2015 | 1.544 | 54,2 | 1.305 | 45,8 | 2.478 | 87,0 | 371 | 13,0 | 343 | 12,0 | 2.506 | 88,0 | 2.849 | 100,0 | ||
| 2016 | 1.599 | 54,8 | 1.319 | 45,2 | 2.509 | 86,0 | 409 | 14,0 | 348 | 11,9 | 2.570 | 88,1 | 2.918 | 100,0 | ||
| 2017 | 1.644 | 55,0 | 1.344 | 45,0 | 2.544 | 85,1 | 444 | 14,9 | 370 | 12,4 | 2.618 | 87,6 | 2.988 | 100,0 | ||
| 2018 | 1.660 | 54,6 | 1.383 | 45,4 | 2.589 | 85,1 | 454 | 14,9 | 379 | 12,5 | 2.664 | 87,5 | 3.043 | 100,0 | ||
| 2019 | 1.650 | 53,9 | 1.412 | 46,1 | 2.570 | 83,9 | 491 | 16,0 | 378 | 12,3 | 2.684 | 87,7 | 3.062 | 100,0 | ||
| 2020 | 1.640 | 53,3 | 1.437 | 46,7 | 2.585 | 84,0 | 491 | 16,0 | 381 | 12,4 | 2.696 | 87,6 | 3.077 | 100,0 | ||
| 2021 | 1.664 | 53,9 | 1.425 | 46,1 | 2.571 | 83,2 | 517 | 16,7 | 359 | 11,6 | 2.730 | 88,4 | 3.089 | 100,0 | ||
| 2022 | 1.670 | 53,5 | 1.450 | 46,5 | 2.611 | 83,7 | 509 | 16,3 | 364 | 11,7 | 2.756 | 88,3 | 3.120 | 100,0 | ||
| 2023 | 1.655 | 53,7 | 1.429 | 46,3 | 2.553 | 82,8 | 531 | 17,2 | 362 | 11,7 | 2.722 | 88,3 | 3.084 | 100,0 | ||
| Männer | Frauen | Deutsche | Ausländer | ||||
| unter 25 Jahre | 25 Jahre und älter |

Adresssuche
