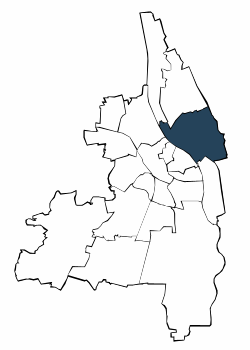
| Jahr | Männer | Frauen | Deutsche | Ausländer | unter 25 Jahre | 25 Jahre und älter | Insgesamt | |||||||||
| Anzahl | % | Anzahl | % | Anzahl | % | Anzahl | % | Anzahl | % | Anzahl | % | Anzahl | % | |||
| 2009 | 6.139 | 54,4 | 5.150 | 45,6 | 9.265 | 82,1 | 2.024 | 17,9 | 1.574 | 13,9 | 9.715 | 86,1 | 11.289 | 100,0 | ||
| 2010 | 6.348 | 54,3 | 5.348 | 45,7 | 9.472 | 81,0 | 2.224 | 19,0 | 1.674 | 14,3 | 10.022 | 85,7 | 11.696 | 100,0 | ||
| 2011 | 6.680 | 54,9 | 5.491 | 45,1 | 9.760 | 80,2 | 2.411 | 19,8 | 1.775 | 14,6 | 10.396 | 85,4 | 12.171 | 100,0 | ||
| 2012 | 6.807 | 55,2 | 5.532 | 44,8 | 9.733 | 78,9 | 2.606 | 21,1 | 1.797 | 14,6 | 10.542 | 85,4 | 12.339 | 100,0 | ||
| 2013 | 7.227 | 55,5 | 5.793 | 44,5 | 10.158 | 78,0 | 2.861 | 22,0 | 1.865 | 14,3 | 11.155 | 85,7 | 13.020 | 100,0 | ||
| 2014 | 7.397 | 55,8 | 5.860 | 44,2 | 10.130 | 76,4 | 3.127 | 23,6 | 1.742 | 13,1 | 11.515 | 86,9 | 13.257 | 100,0 | ||
| 2015 | 7.865 | 55,9 | 6.215 | 44,1 | 10.542 | 74,9 | 3.538 | 25,1 | 1.905 | 13,5 | 12.175 | 86,5 | 14.080 | 100,0 | ||
| 2016 | 8.196 | 56,1 | 6.417 | 43,9 | 10.781 | 73,8 | 3.832 | 26,2 | 1.852 | 12,7 | 12.761 | 87,3 | 14.613 | 100,0 | ||
| 2017 | 8.479 | 56,4 | 6.556 | 43,6 | 10.830 | 72,0 | 4.205 | 28,0 | 1.908 | 12,7 | 13.127 | 87,3 | 15.035 | 100,0 | ||
| 2018 | 8.656 | 56,5 | 6.670 | 43,5 | 10.857 | 70,8 | 4.469 | 29,2 | 1.965 | 12,8 | 13.361 | 87,2 | 15.326 | 100,0 | ||
| 2019 | 8.698 | 56,7 | 6.654 | 43,3 | 10.690 | 69,6 | 4.662 | 30,4 | 1.937 | 12,6 | 13.415 | 87,4 | 15.352 | 100,0 | ||
| 2020 | 8.704 | 56,7 | 6.650 | 43,3 | 10.535 | 68,6 | 4.819 | 31,4 | 1.901 | 12,4 | 13.453 | 87,6 | 15.354 | 100,0 | ||
| 2021 | 8.948 | 56,8 | 6.819 | 43,2 | 10.588 | 67,2 | 5.179 | 32,8 | 1.999 | 12,7 | 13.768 | 87,3 | 15.767 | 100,0 | ||
| 2022 | 9.172 | 56,9 | 6.942 | 43,1 | 10.618 | 65,9 | 5.496 | 34,1 | 1.986 | 12,3 | 14.128 | 87,7 | 16.114 | 100,0 | ||
| 2023 | 9.190 | 56,7 | 7.010 | 43,3 | 10.589 | 65,4 | 5.610 | 34,6 | 1.910 | 11,8 | 14.290 | 88,2 | 16.200 | 100,0 | ||
| Männer | Frauen | Deutsche | Ausländer | ||||
| unter 25 Jahre | 25 Jahre und älter |

Adresssuche
