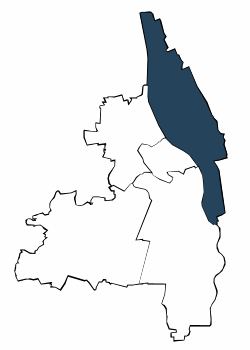
| Jahr | Männer | Frauen | Deutsche | Ausländer | unter 25 Jahre | 25 Jahre und älter | Insgesamt | |||||||||
| Anzahl | % | Anzahl | % | Anzahl | % | Anzahl | % | Anzahl | % | Anzahl | % | Anzahl | % | |||
| 2009 | 11.777 | 54,3 | 9.929 | 45,7 | 18.596 | 85,7 | 3.110 | 14,3 | 2.923 | 13,5 | 18.783 | 86,5 | 21.706 | 100,0 | ||
| 2010 | 12.132 | 54,1 | 10.299 | 45,9 | 19.044 | 84,9 | 3.387 | 15,1 | 3.038 | 13,5 | 19.393 | 86,5 | 22.431 | 100,0 | ||
| 2011 | 12.751 | 54,7 | 10.575 | 45,3 | 19.643 | 84,2 | 3.683 | 15,8 | 3.221 | 13,8 | 20.105 | 86,2 | 23.326 | 100,0 | ||
| 2012 | 12.960 | 54,7 | 10.715 | 45,3 | 19.685 | 83,1 | 3.990 | 16,9 | 3.187 | 13,5 | 20.488 | 86,5 | 23.675 | 100,0 | ||
| 2013 | 13.580 | 55,0 | 11.105 | 45,0 | 20.343 | 82,4 | 4.341 | 17,6 | 3.242 | 13,1 | 21.443 | 86,9 | 24.685 | 100,0 | ||
| 2014 | 13.745 | 55,0 | 11.252 | 45,0 | 20.328 | 81,3 | 4.669 | 18,7 | 3.055 | 12,2 | 21.942 | 87,8 | 24.997 | 100,0 | ||
| 2015 | 14.447 | 55,1 | 11.791 | 44,9 | 20.963 | 79,9 | 5.275 | 20,1 | 3.286 | 12,5 | 22.952 | 87,5 | 26.238 | 100,0 | ||
| 2016 | 14.968 | 55,3 | 12.097 | 44,7 | 21.325 | 78,8 | 5.740 | 21,2 | 3.225 | 11,9 | 23.840 | 88,1 | 27.065 | 100,0 | ||
| 2017 | 15.372 | 55,4 | 12.385 | 44,6 | 21.475 | 77,4 | 6.282 | 22,6 | 3.323 | 12,0 | 24.434 | 88,0 | 27.757 | 100,0 | ||
| 2018 | 15.684 | 55,4 | 12.618 | 44,6 | 21.622 | 76,4 | 6.679 | 23,6 | 3.420 | 12,1 | 24.882 | 87,9 | 28.302 | 100,0 | ||
| 2019 | 15.827 | 55,5 | 12.680 | 44,5 | 21.538 | 75,6 | 6.968 | 24,4 | 3.423 | 12,0 | 25.084 | 88,0 | 28.507 | 100,0 | ||
| 2020 | 15.799 | 55,4 | 12.741 | 44,6 | 21.340 | 74,8 | 7.199 | 25,2 | 3.368 | 11,8 | 25.172 | 88,2 | 28.540 | 100,0 | ||
| 2021 | 16.195 | 55,5 | 12.994 | 44,5 | 21.512 | 73,7 | 7.676 | 26,3 | 3.474 | 11,9 | 25.715 | 88,1 | 29.189 | 100,0 | ||
| 2022 | 16.439 | 55,5 | 13.172 | 44,5 | 21.490 | 72,6 | 8.121 | 27,4 | 3.430 | 11,6 | 26.181 | 88,4 | 29.611 | 100,0 | ||
| 2023 | 16.509 | 55,5 | 13.234 | 44,5 | 21.369 | 71,8 | 8.373 | 28,2 | 3.318 | 11,2 | 26.425 | 88,8 | 29.743 | 100,0 | ||
| Männer | Frauen | Deutsche | Ausländer | ||||
| unter 25 Jahre | 25 Jahre und älter |

Adresssuche
