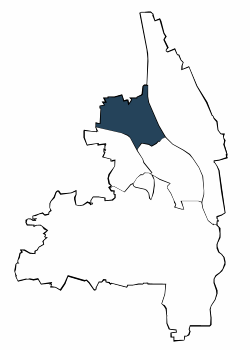
| Jahr | Männer | Frauen | Deutsche | Ausländer | unter 25 Jahre | 25 Jahre und älter | Insgesamt | |||||||||
| Anzahl | % | Anzahl | % | Anzahl | % | Anzahl | % | Anzahl | % | Anzahl | % | Anzahl | % | |||
| 2009 | 5.437 | 55,3 | 4.398 | 44,7 | 7.773 | 79,0 | 2.062 | 21,0 | 1.561 | 15,9 | 8.274 | 84,1 | 9.835 | 100,0 | ||
| 2010 | 5.759 | 56,2 | 4.485 | 43,8 | 7.968 | 77,8 | 2.276 | 22,2 | 1.600 | 15,6 | 8.644 | 84,4 | 10.244 | 100,0 | ||
| 2011 | 6.258 | 56,6 | 4.796 | 43,4 | 8.481 | 76,7 | 2.573 | 23,3 | 1.756 | 15,9 | 9.298 | 84,1 | 11.054 | 100,0 | ||
| 2012 | 6.385 | 56,4 | 4.930 | 43,6 | 8.541 | 75,5 | 2.774 | 24,5 | 1.773 | 15,7 | 9.542 | 84,3 | 11.315 | 100,0 | ||
| 2013 | 6.647 | 56,6 | 5.096 | 43,4 | 8.684 | 74,0 | 3.058 | 26,0 | 1.830 | 15,6 | 9.913 | 84,4 | 11.743 | 100,0 | ||
| 2014 | 7.086 | 57,6 | 5.214 | 42,4 | 8.725 | 70,9 | 3.575 | 29,1 | 1.902 | 15,5 | 10.398 | 84,5 | 12.300 | 100,0 | ||
| 2015 | 7.574 | 58,2 | 5.430 | 41,8 | 8.959 | 68,9 | 4.045 | 31,1 | 1.969 | 15,1 | 11.035 | 84,9 | 13.004 | 100,0 | ||
| 2016 | 7.935 | 58,6 | 5.614 | 41,4 | 9.101 | 67,2 | 4.447 | 32,8 | 2.001 | 14,8 | 11.548 | 85,2 | 13.549 | 100,0 | ||
| 2017 | 8.433 | 59,4 | 5.765 | 40,6 | 9.213 | 64,9 | 4.985 | 35,1 | 2.049 | 14,4 | 12.149 | 85,6 | 14.198 | 100,0 | ||
| 2018 | 8.838 | 59,5 | 6.023 | 40,5 | 9.333 | 62,8 | 5.528 | 37,2 | 2.171 | 14,6 | 12.690 | 85,4 | 14.861 | 100,0 | ||
| 2019 | 9.014 | 59,3 | 6.176 | 40,7 | 9.323 | 61,4 | 5.867 | 38,6 | 2.199 | 14,5 | 12.991 | 85,5 | 15.190 | 100,0 | ||
| 2020 | 9.033 | 59,2 | 6.234 | 40,8 | 9.174 | 60,1 | 6.093 | 39,9 | 2.259 | 14,8 | 13.008 | 85,2 | 15.267 | 100,0 | ||
| 2021 | 9.093 | 59,0 | 6.313 | 41,0 | 9.172 | 59,5 | 6.234 | 40,5 | 2.246 | 14,6 | 13.160 | 85,4 | 15.406 | 100,0 | ||
| 2022 | 9.358 | 59,1 | 6.478 | 40,9 | 9.323 | 58,9 | 6.513 | 41,1 | 2.164 | 13,7 | 13.672 | 86,3 | 15.836 | 100,0 | ||
| Männer | Frauen | Deutsche | Ausländer | ||||
| unter 25 Jahre | 25 Jahre und älter |

Adresssuche
