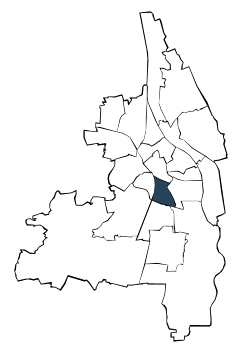
| Jahr | Männer | Frauen | Deutsche | Ausländer | unter 25 Jahre | 25 Jahre und älter | Insgesamt | |||||||||
| Anzahl | % | Anzahl | % | Anzahl | % | Anzahl | % | Anzahl | % | Anzahl | % | Anzahl | % | |||
| 2009 | 1.497 | 52,6 | 1.347 | 47,4 | 2.282 | 80,2 | 562 | 19,8 | 370 | 13,0 | 2.474 | 87,0 | 2.844 | 100,0 | ||
| 2010 | 1.588 | 53,1 | 1.403 | 46,9 | 2.392 | 80,0 | 599 | 20,0 | 395 | 13,2 | 2.596 | 86,8 | 2.991 | 100,0 | ||
| 2011 | 1.762 | 54,2 | 1.488 | 45,8 | 2.602 | 80,1 | 648 | 19,9 | 444 | 13,7 | 2.806 | 86,3 | 3.250 | 100,0 | ||
| 2012 | 1.796 | 54,1 | 1.524 | 45,9 | 2.682 | 80,8 | 638 | 19,2 | 461 | 13,9 | 2.859 | 86,1 | 3.320 | 100,0 | ||
| 2013 | 1.874 | 54,7 | 1.549 | 45,3 | 2.748 | 80,3 | 675 | 19,7 | 457 | 13,4 | 2.966 | 86,6 | 3.423 | 100,0 | ||
| 2014 | 1.889 | 54,1 | 1.600 | 45,9 | 2.791 | 80,0 | 698 | 20,0 | 432 | 12,4 | 3.057 | 87,6 | 3.489 | 100,0 | ||
| 2015 | 2.033 | 54,4 | 1.706 | 45,6 | 2.972 | 79,5 | 767 | 20,5 | 471 | 12,6 | 3.268 | 87,4 | 3.739 | 100,0 | ||
| 2016 | 2.120 | 55,0 | 1.735 | 45,0 | 3.021 | 78,4 | 834 | 21,6 | 496 | 12,9 | 3.359 | 87,1 | 3.855 | 100,0 | ||
| 2017 | 2.214 | 55,0 | 1.811 | 45,0 | 3.128 | 77,7 | 897 | 22,3 | 490 | 12,2 | 3.535 | 87,8 | 4.025 | 100,0 | ||
| 2018 | 2.233 | 54,0 | 1.900 | 46,0 | 3.207 | 77,6 | 926 | 22,4 | 500 | 12,1 | 3.633 | 87,9 | 4.133 | 100,0 | ||
| 2019 | 2.270 | 53,5 | 1.973 | 46,5 | 3.282 | 77,4 | 961 | 22,6 | 502 | 11,8 | 3.741 | 88,2 | 4.243 | 100,0 | ||
| 2020 | 2.283 | 53,5 | 1.985 | 46,5 | 3.310 | 77,6 | 958 | 22,4 | 503 | 11,8 | 3.765 | 88,2 | 4.268 | 100,0 | ||
| 2021 | 2.360 | 53,9 | 2.015 | 46,1 | 3.345 | 76,5 | 1.030 | 23,5 | 549 | 12,5 | 3.826 | 87,5 | 4.375 | 100,0 | ||
| 2022 | 2.461 | 53,9 | 2.102 | 46,1 | 3.443 | 75,5 | 1.120 | 24,5 | 626 | 13,7 | 3.937 | 86,3 | 4.563 | 100,0 | ||
| 2023 | 2.501 | 54,1 | 2.125 | 45,9 | 3.461 | 74,8 | 1.165 | 25,2 | 589 | 12,7 | 4.037 | 87,3 | 4.626 | 100,0 | ||
| Männer | Frauen | Deutsche | Ausländer | ||||
| unter 25 Jahre | 25 Jahre und älter |

Adresssuche
