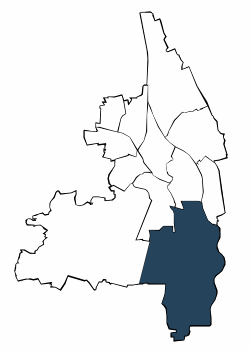
| Jahr | Männer | Frauen | Deutsche | Ausländer | unter 25 Jahre | 25 Jahre und älter | Insgesamt | |||||||||
| Anzahl | % | Anzahl | % | Anzahl | % | Anzahl | % | Anzahl | % | Anzahl | % | Anzahl | % | |||
| 2009 | 4.698 | 52,7 | 4.211 | 47,3 | 7.957 | 89,3 | 952 | 10,7 | 1.112 | 12,5 | 7.797 | 87,5 | 8.909 | 100,0 | ||
| 2010 | 4.784 | 52,8 | 4.283 | 47,2 | 8.033 | 88,6 | 1.034 | 11,4 | 1.164 | 12,8 | 7.903 | 87,2 | 9.067 | 100,0 | ||
| 2011 | 4.972 | 52,8 | 4.448 | 47,2 | 8.251 | 87,6 | 1.169 | 12,4 | 1.221 | 13,0 | 8.199 | 87,0 | 9.420 | 100,0 | ||
| 2012 | 5.099 | 53,1 | 4.511 | 46,9 | 8.393 | 87,3 | 1.217 | 12,7 | 1.248 | 13,0 | 8.362 | 87,0 | 9.610 | 100,0 | ||
| 2013 | 5.215 | 53,1 | 4.597 | 46,9 | 8.526 | 86,9 | 1.286 | 13,1 | 1.267 | 12,9 | 8.545 | 87,1 | 9.812 | 100,0 | ||
| 2014 | 5.271 | 52,9 | 4.684 | 47,1 | 8.582 | 86,2 | 1.373 | 13,8 | 1.212 | 12,2 | 8.743 | 87,8 | 9.955 | 100,0 | ||
| 2015 | 5.463 | 53,1 | 4.824 | 46,9 | 8.793 | 85,5 | 1.494 | 14,5 | 1.262 | 12,3 | 9.025 | 87,7 | 10.287 | 100,0 | ||
| 2016 | 5.689 | 53,8 | 4.893 | 46,2 | 8.938 | 84,5 | 1.644 | 15,5 | 1.259 | 11,9 | 9.323 | 88,1 | 10.582 | 100,0 | ||
| 2017 | 5.842 | 53,6 | 5.063 | 46,4 | 9.080 | 83,3 | 1.825 | 16,7 | 1.215 | 11,1 | 9.690 | 88,9 | 10.905 | 100,0 | ||
| 2018 | 6.042 | 54,0 | 5.147 | 46,0 | 9.199 | 82,2 | 1.990 | 17,8 | 1.280 | 11,4 | 9.909 | 88,6 | 11.189 | 100,0 | ||
| 2019 | 6.010 | 53,6 | 5.197 | 46,4 | 9.145 | 81,6 | 2.062 | 18,4 | 1.307 | 11,7 | 9.900 | 88,3 | 11.207 | 100,0 | ||
| 2020 | 5.967 | 53,8 | 5.116 | 46,2 | 8.945 | 80,7 | 2.138 | 19,3 | 1.231 | 11,1 | 9.852 | 88,9 | 11.083 | 100,0 | ||
| 2021 | 6.051 | 53,7 | 5.215 | 46,3 | 8.975 | 79,7 | 2.291 | 20,3 | 1.268 | 11,3 | 9.998 | 88,7 | 11.266 | 100,0 | ||
| 2022 | 6.163 | 53,9 | 5.277 | 46,1 | 9.078 | 79,4 | 2.362 | 20,6 | 1.271 | 11,1 | 10.169 | 88,9 | 11.440 | 100,0 | ||
| 2023 | 6.262 | 54,1 | 5.306 | 45,9 | 9.090 | 78,6 | 2.478 | 21,4 | 1.300 | 11,2 | 10.268 | 88,8 | 11.568 | 100,0 | ||
| Männer | Frauen | Deutsche | Ausländer | ||||
| unter 25 Jahre | 25 Jahre und älter |

Adresssuche
